

Internet of SCADA, or, why does my HVAC blow?

We live in a house that was new-built, so it’s got all the modern trimmings. It’s also got all the modern cut corners, including an air conditioning system (two, actually) that even 12 years later we’re still struggling with. It seems that every year or two something else goes wrong, especially with the combined cooling / heat pump unit that handles the upstairs.
I’ve been thinking for a while that I should be able to build a temperature monitor to track how the system is running, to detect problems (loss of freon, etc.) early, and maybe even forestall costly repairs. Maybe. So I asked for some Arduino gear for Christmas, and earlier this summer, I finally started playing around with it.
Then…right on schedule, in the height of the summer heat, our upstairs system stopped cooling again. Our HVAC company came out, pumped two pounds of freon into the system (I really gotta start doing that myself – far cheaper), and scheduled a comprehensive leak search for mid-September (just in case we have to disable the system for a long stretch, we wanted it to be in a season where we might not miss it).
Then just before I went to DEF CON, I noticed (using my 20-year-old Radio Shack thermometer) that the AC unit didn’t seem to be cooling as much as before. After returning, it seemed…okay…but still not ideal, so I rushed a (greatly simplified) monitoring circuit into play. I just got it working this week, and already I’m finding some interesting results.
I’m still trying to figure out the best way to sense thermostat calls for compressor, heat, and fans – do I use clip-on current sensors, inline current sensors, voltage drop sensors, opto-isolaters – and how do I integrate those sensors into the 1-Wire bus… So for now, I only have a few temperature sensors.
First, some eye-candy:
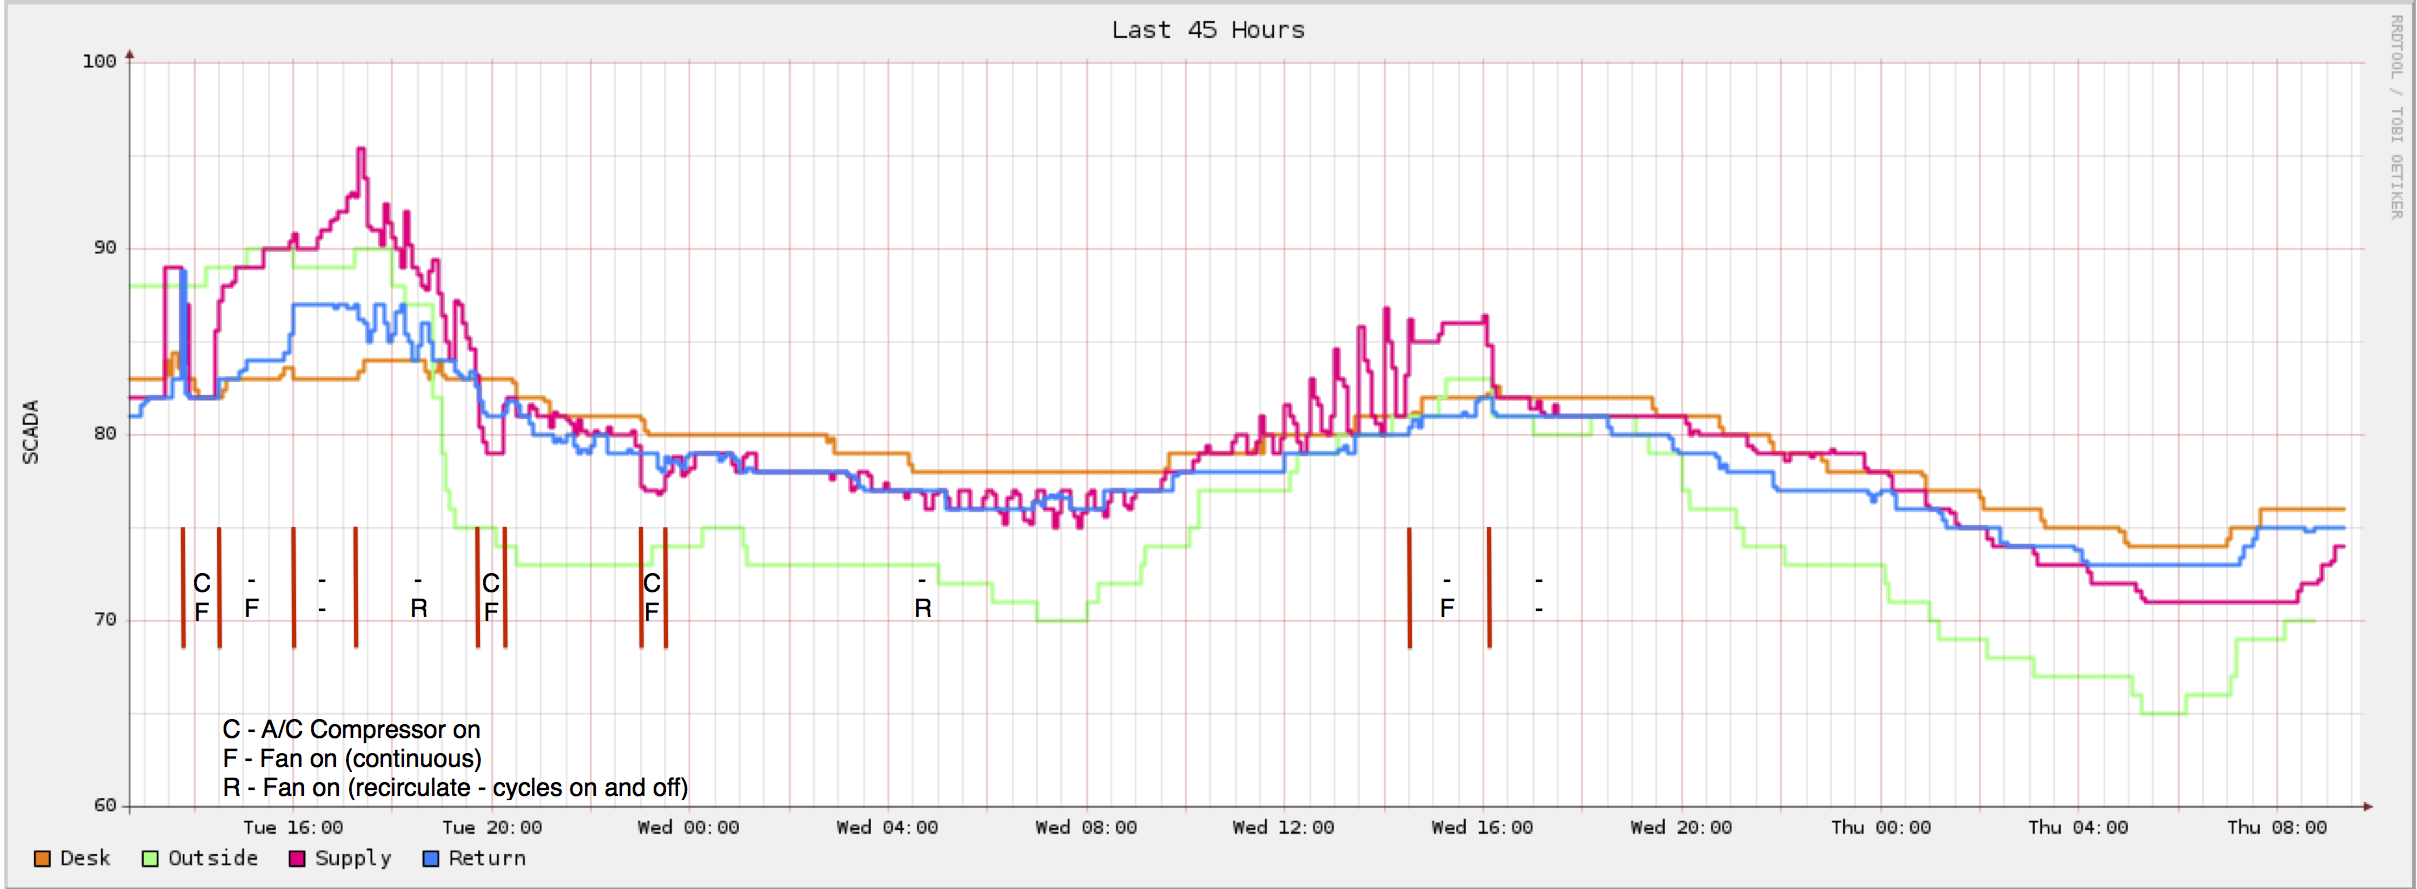
Two-day Stripchart
Here, the orange line is one of two sensors on a table (in the next graph they’re individually shown as red and blue). The green line is an outside temperature taken as an average of a few web-accessible weather stations in the area (a few in nearby neighborhoods, plus Dulles airport), so it’s a reasonable approximation of the temperature near my home. Blue is the air temperature at the cold air return directly above the desk (and thermostat), and red is the supply register (output vent) directly above a window, maybe 8 feet from the other three sensors.
One important measurement is the cooling drop produced by the A/C system. Because it’s currently malfunctioning I don’t have the compressor running. But I ran it for three brief periods, about a half hour each, just to see what it looks like on the graph. This is, in fact, the primary reason I wanted to start this project. One typically expects a 10-15 degree temperature drop across an A/C unit’s cooling coil, though the actual drop from cold air return back to the room might be a little less. After we had coolant added in July, my old thermometer measured that drop at just about 10 degrees.
When the compressor ran from about 1:45-2:30 on Tuesday, the supply and return lines were at the same temperature. That is, it showed ZERO cooling effect. When run twice that evening (about 8:00 and again about 11:00) the graph shows 2, maybe 3 degrees of cooling. So, obviously, it’s broken. My long term plan includes emailed and even a beeping alarm unit when this drop habitually reduces below some threshold….so I was glad to see what “broken” looks like so early in the system’s development.
What gets really fun is playing with the furnace fan. For about 90 minutes (after I first turned off the compressor) I left the fan set to “on,” that is, continuously running. The air coming out of the register by the window was consistently 5 or more degrees warmer than what went into the system at the cold air return in the same room. So either I’m getting an ambient heating effect from the vent’s location (in the ceiling, near a large window), or the duct work in the attic is heating things up significantly.
Then I turned off the furnace fan, and the register temperature continued to rise, until I switched to “Circulate,” in which the furnace fan cycles on and off. I’d had no idea how that mode actually worked (I vaguely presumed it was somewhat tied to the thermostat, and might be if the room temperature was actually close to “reasonable”) but here it seems to just be about 15 minutes on, 15 minutes off.
When the fan first kicked in, the register temperature shot up (probably expelling warm air that’s been sitting in the attic ductwork), then it drops a bit, and sort of settles for a bit. Then it drops again (I guess when the fan turns off – again, I really need a sensor on that relay), and then shoots back up again when the fan restarts. You can really see the pattern on Wednesday afternoon, where the low temperature (fan off) seems to be about equal to the room temperature, while the high temperature climbs in a fairly obvious curve.
Finally, about 2:30 on Wednesday I switched the fan back to “constantly on” and saw the temperature rise again, but then it stabilized somewhat lower than the curve I discerned before. Perhaps the constant flow kept the air in the ductwork from warming up exponentially (like in a greenhouse) but heat was still being transferred even to the moving air.
I ended the experimenting about 4:00, when I switched the fan off completely, and the register temperature dropped back to match that of the other sensors in the room (which was pretty close to the outside temperature as well).
In fact, there’s a pretty strong correlation (well, visually, anyway…I’m not enough of a data geek to quantify that correlation) between the outside temperature and that of the air coming through the register. So again, there’s something happening here, either heating in the attic, or some halo effect near the window / ceiling location of the sensor, or maybe a little of both.
Then yesterday I tried something different.
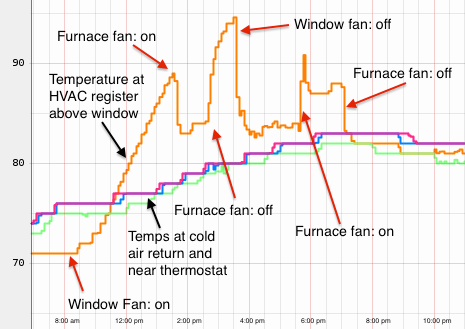
Fan Details
Here, the red and blue lines are the sensors on the table (actually in adjacent holes on a breadboard, so it’s interesting to see the blue sensor lagging the red one), the orange is the output (register) temperature, and the green is the cold air return (about 5 feet above the table). What’s really important is the relationship between the vent and the other three (which kind of give a general ambient room temperature). (these are the default colors my RRD setup uses, not the custom setup I used when I hand-crafted the first graph from logged data).
We know that our A/C will be down for a while, so we elected to just wait until the scheduled leak test in a couple weeks…partially as an experiment in A/C-free living (which our kids don’t appreciate quite as much, BTW). So we put a window fan in the bedroom, right below the A/C register I keep referring to. Overnight, it’s set to pull cooler air in from outside. During the day, it blows air out, on the theory that it’ll pull cooler air from the basement and 1st floor, which has an HVAC system that’s still working. I don’t remember when I switched direction on the fan, but it was probably between 7:30 and 8:00.
Shortly afterwards, the register temperature climbs steadily, which isn’t surprising given the past data and the fact that this window gets full sun in the morning. Then, just to verify the previous days’ data, I turned the furnace fan to continuous on at about 1:30. The temperature at the register dropped over 5 degrees, but still remained significantly higher than the temperature in the room. I turned it back off, and the line climbed back up to resume the earlier slope. Then I had a crazy idea: What if the window fan was sucking air out of the register? I turned it off, and the temperature plummeted, back to an unsteady 2-3 degrees above the room temperature. Turning the furnace fan back on again resumed the high temperature readings from that register, higher than before, but still consistent with the rising temperatures outside (not shown on this graph). When it was finally turned off, with the window turned off, the temperature fell to match the rest of the sensors in the room.
With the window fan and furnace fans both turned off, today’s graph has been four very similar lines, all within about 3 degrees of yesterday’s values at the same time. Certainly, the weather today may be different from that of yesterday or the day before (it got quite cool Tuesday night due to some rains in the area), but I’m hoping that the system will show that the room temperature is a little more stable (and hopefully lower) now that I’m not sucking hot air out of the attic ductwork.
I’m also more than a little concerned about my preliminary conclusion, that the attic adds 5 or more degrees to the air as it passes through the system. If the coil is really expected to drop air temperature by 10-15 degrees, then I’m losing a full 33% efficiency just by exposure to the attic air (and these systems are so efficient to begin with). There’s a roof-mounted ventilation fan, which should be pulling some hot air out of the attic, and monitoring that (and the attic temperature in general) is on my list for this project.
But I feel like the ductwork shouldn’t be absorbing that much heat to begin with. I don’t know if it’s a function of the air return, or the air distribution, or the furnace unit itself, but it really does seem like I may need to do some work up there. Right now, it’s a rat’s nest of flexible ductwork, leading from the furnace to smaller distribution boxes to further flexible ducts, etc. All of them are running at 4-6’ above the attic floor, with long swoops and droops. I seriously wonder whether ripping that all out and installing rigid ducts, at the floor joist level and covered with heaps of blown-in insulation, might make a significant difference here.
It’s also possible that the heat increase isn’t coming from the attic at all, but from the much larger cold air return in the hallway by the kids’ rooms. I’ll need to get another sensor over there to see if that’s the case, but generally, the master bedroom (where all these other sensors are located) feels a lot warmer than the hall, so I’m still leaning towards the attic ductwork being a problem.
Either way, this is an amazing amount of information, and may already be helping me better understand and diagnose our long-running HVAC problems, all from only a couple days’ worth of logging and an Arduino-based sensor that took less than a day to cobble together (ignoring delays from a failed WiFi breakout board). I can’t wait until I have both my HVAC systems fully instrumented, with real local outdoor and attic temperatures as well.
Yay, data!