

Update on August Ping Storms

A few days ago, I wrote about what GreyNoise have been calling “Noise Storms,” extended periods of high-volume ping traffic detected by many of their sensors, coming from…many different sources. The most intriguing of these were packets with the word “LOVE” in plaintext in the ping payload, and in my post, I offered a possible explanation of that traffic. At least, at a technical level – what they’re doing with those packets, well, that’s a different puzzle.
The next day, I turned my attention to some other ping payloads seen in the storm, and the day after that, I finished deciphering (I think) the third set of packets. So now it’s time for a quick explanation of what I’ve been up to.
The August Storm
(I wonder if the GreyNoise folks have internal code names for individual storms? For now, this is “August.”) Shortly after the StormWatch webcast two weeks ago, GreyNoise published a set of packet capture data (pcaps) on GitHub. These included traffic they identified as (apparently) originating in Brazil, between August 16 and August 30, 2024. In summary, these files contained five different ping payloads, spread across nearly three million packets:
| Number | Payload fragment (hex) | Payload start (ASCII) | My Name |
|---|---|---|---|
| 2,851,686 | 4c4f5645 605a0000 | LOVE`Z.. | LOVE |
| 5,706 | 20212223 24252627 | .!"#$%&' | Linux Ping |
| 4,432 | 17ec4e6a 6f4c7354 | (nothing legible) | Seventeens |
| 399 | 6c69626f 70696e67 | liboping | liboping |
| 4 | 6abcccf9 59b1d941 | (nothing legible) |
(these are just the echo-request packets, not request/reply pairs).
Love Packets
These were covered in detail in my prior post. Basically, they have a payload that looks like this:
4c4f5645 605a0000 3a4e2169 91010000
With another 40 bytes of NULLs (00) following. I’ve been breaking the payloads up into 32-bit words (4 bytes, or 8 hexadecimal characters) just because it’s easier for me to look at them that way. Helpfully, a lot of the data also seems to break down on those borders (or 2-byte borders). After some head scratching, tool hacking, a healthy dose of serendipity, and a bunch of research to confirm some hunches, I concluded that these packets looked like this:
| Word Number | Example | Use |
|---|---|---|
| 1 | “LOVE” | Magic number to identify ping type |
| 2 | 605a 0000 | Unsure. Possibly sequence and “scan session” number. The 0000 never changes. |
| 3-4 | 3a4e216991010000 | 64-bit UNIX epoch timestamp, stored backwards (little-endian format) |
The “serendipity” I referred to earlier was when my packet analysis library tentatively identified one packet as a HiPerConTracer packet. These aren’t quite exactly that format, but they’re close. Here’s what’s different:
- The Magic header is fixed, instead of being randomly generated for each packet tracing session.
- The 0000 in word 2 is used, in HiPerConTracer, to help brute-force a consistent ICMP checksum value, which helps ensure subsequent packets follow the same path through load balancers. Here, it’s unused, just left as all zeroes.
- The timestamp is in milliseconds, using the UNIX epoch, instead of microseconds, using an epoch based in 1976.
So it’s not exactly that tool, but I suspect it’s a modified version of the tool, or something inspired by it. At the very least, the bulk of the random looking data was definitely a timestamp (which, after decoding, was a near perfect match for the sniff time). All that’s left is the second word, which in HiPerConTracer is a time-to-live counter, and a field marking the “Round” of the packet (I guess different ping sessions?) I haven’t looked further into how HiPerConTracer works to fully understand those fields, though, so I can only speculate whether these bytes are being used similarly here.
What exactly it’s being used for – again, that level of analysis isn’t somewhere I’ve gone yet.
Oddballs
I only have four oddballs to look at:
Date_Time               TTL   Prot  Src_IP        Dst_IP          Typ  ChkSum  id    Seq   Payload
2024-08-21 00:07:05.52  72..  1     206.42.58.23  xx.xx.14.13     8    0x5550  3806  0000  6a:bc:cc:f9:59:b1:d9:41
2024-08-23 00:08:34.54  72..  1     206.42.58.23  xx.xx.14.42     8    0xe220  3806  0000  7b:14:86:d0:02:b2:d9:41
2024-08-25 13:50:09.28  70..  1     206.42.58.23  xx.xx.14.224    8    0x713c  3806  0000  7b:14:1e:b4:db:b2:d9:41
2024-08-27 03:07:22.59  67..  1     206.42.58.23  xx.xx.194.171   8    0xbe54  3806  0000  60:e5:68:ca:5e:b3:d9:41
Thanks to some GreyNoise connections, I was able to acquire another 18 packets from the same host. In all, I have 22 pings, hitting 21 different GreyNoise sensors, over a 3 month timeframe. Each “session” was, to quote a phrase, “One ping only.”
I haven’t been able to figure out much from the payload, other than that it does appear to be slowly counting upwards. I couldn’t find any obvious connection to time, though this morning’s analysis was kind of rushed, and I’m not entirely confident in my method just yet. But it appears that these numbers are not moving at the same rate as the timestamps. That is, I compared the difference between two consecutive pings (though perhaps days apart), looking at both timestamps, and payloads, and the differences were not consistently proportional.
I’m not explaining this well. Lemme try again.
I figured that if, say, two packets differed by 1,000,000 in their timestamps, and 1,000,243 in their payloads, and if this difference were reasonably consistent and proportional between any two packets… IF that were true, then the payload would clearly be a timestamp, and I’d just have to figure out the base epoch they used (what “0” means). But that wasn’t the case here – the “distance” between timestamps varied wildly. Or at least, I think they did (again, I was kind of rushing through it).
If I had to guess, I’d say this particular actor is sending one ping at a time, to one host, then incrementing a counter, then sending another single ping to a different host, incrementing again, etc. Heh. I’m gonna rename this traffic category “Ramius.” Because why not?
Linux Ping Packets
These were the last packet type I decoded, but I’ll describe them first because they’re easiest. These packets look like a typical Linux ping, but they have four extra fields in the payload before the usual “10 11 12 13….36 37” sequence:
2024-08-18 16:15:53.003291 138.199.4.1 xx.xx.14.243 6956c266 00000000 ef8f0300 00000000 10111213 (....) 34353637
Here, the first word (6956c266) was pretty quickly identified as a standard UNIX timestamp. It was even in the “right” order (big-endian). (Honestly, I can’t remember whether I latched onto big-endian or little-endian when I first started caring about such things… I worked on so many different architectures early on, that it was probably a mix. And that’s not even counting the mainframes.)
Anyway, that’s the first block in the payload. The 2nd and 4th words were all 00, and the 5th word through the end of the payload was the 10111213…sequence. The 3rd word (here, ef8f0300) bugged me for a while.
I did some frequency analysis on word 3, and the first two bytes were very evenly distributed across all 256 possible values. But the third byte had one odd limitation:
       _0   _1   _2   _3   _4   _5   _6   _7   _8   _9   _A   _B   _C   _D   _E   _F
0_    366  435  409  437  478  471  457  427  386  355  244  266  276  288  323   88
1_      .    .    .    .    .    .    .    .    .    .    .    .    .    .    .    .
2_      .    .    .    .    .    .    .    .    .    .    .    .    .    .    .    .
    [.... remainder of table deleted...all empty ....]
They all start with 0 as the highest 4 bits. Further, “0F” was nearly 1/4 as common as all the rest of the numbers (which seemed pretty evenly spread out). Then it hit me that if this were little endian… it could be a fractional timestamp.
I converted 1,000,000 to hex – guessing that these are microseconds – and that number is 0f4240. So I searched for all packets with “0f” in the 3rd byte, and not a single one had a second byte higher than 0x42. Which, to me anyway, confirmed my suspicion.
So these packets have a 32-bit UNIX timestamp, and a little-endian fractional timestamp in microseconds. Plus the boring payload after the timestamps.
Again, some kind of ping-based network timing system? Embed a microsecond timestamp in the payload, and compare when you get it back, to get a rough feel for round trip time?
Liboping
There are also about 400 packets that are just some kind of typical ping. The exact payload is:
liboping -- ICMP ping library <http://octo.it/liboping/>
Just a plain vanilla scanner? I honestly didn’t look into these at all. Seemed pretty straightforward.
The Seventeens
These packets were by far the most interesting, so I’ve saved them for last. I started by gathering all these packets into one place, and doing a bunch of sorting and grouping.
The first thing I did was to look at the first four bytes of the payload, and group & count them. There were…28 different 4-byte sequences, that each appeared exactly 80 times in the dump. And…3 different 4-byte sequences that each appeared 70 times. Ten sequences appeared 30 times each, and 17 appeared 20 times each. It kept on like this, though with a few outliers (maybe some packets got lost?)
So they seem to be coming in bursts that are multiples of 10 packets long. Okay, this is interesting.
I identified one of the prefixes that appeared in 20 packets and broke those out:
$ ./noise.py greynoise_merged_nolove.pcap --fields time,src,dst,icmp_id,seq,payload -F words |grep 17f063ee

Date_Time                   Src_IP           Dst_IP      id    Seq   Payload
2024-08-29 23:28:51.560421  157.185.174.72   xx.xx.14.1  7ece  1f7f  17f063ee 11dc6c9a 69f69d1c dc9d6b15 xxxx0e01 00000040 17f063ee 11dbe2c1 00
2024-08-29 23:28:51.560459  157.185.174.72   xx.xx.14.1  7ece  1f7f  17f063ee 11dcd778 69f69d1c dc9d6b15 xxxx0e01 00000040 17f063ee 11dbe2c1 00
2024-08-29 23:28:51.560480  157.185.174.72   xx.xx.14.1  7ece  1f7f  17f063ee 11dd0e28 69f69d1c dc9d6b15 xxxx0e01 00000040 17f063ee 11dbe2c1 00
2024-08-29 23:28:51.560480  157.185.174.72   xx.xx.14.1  7ece  1f7f  17f063ee 11dd380b 69f69d1c dc9d6b15 xxxx0e01 00000040 17f063ee 11dbe2c1 00
2024-08-29 23:28:51.560572  157.185.174.72   xx.xx.14.1  7ece  1f7f  17f063ee 11dd6df3 69f69d1c dc9d6b15 xxxx0e01 00000040 17f063ee 11dbe2c1 00
2024-08-29 23:28:51.560600  157.185.174.72   xx.xx.14.1  7ece  1f7f  17f063ee 11dda70a 69f69d1c dc9d6b15 xxxx0e01 00000040 17f063ee 11dbe2c1 00
2024-08-29 23:28:51.560600  157.185.174.72   xx.xx.14.1  7ece  1f7f  17f063ee 11ddd7cc 69f69d1c dc9d6b15 xxxx0e01 00000040 17f063ee 11dbe2c1 00
2024-08-29 23:28:51.560600  157.185.174.72   xx.xx.14.1  7ece  1f7f  17f063ee 11de00e3 69f69d1c dc9d6b15 xxxx0e01 00000040 17f063ee 11dbe2c1 00
2024-08-29 23:28:51.560600  157.185.174.72   xx.xx.14.1  7ece  1f7f  17f063ee 11de2f39 69f69d1c dc9d6b15 xxxx0e01 00000040 17f063ee 11dbe2c1 00
2024-08-29 23:28:51.560600  157.185.174.72   xx.xx.14.1  7ece  1f7f  17f063ee 11df5e9f 69f69d1c dc9d6b15 xxxx0e01 00000040 17f063ee 11dbe2c1 00

2024-08-29 23:28:54.035100  157.185.173.82   xx.xx.14.1  572a  9e0b  17f063ee a5c57cb5 4a016db9 df37db89 xxxx0e01 00000040 17f063ee a5c4efdd 00
2024-08-29 23:28:54.035174  157.185.173.82   xx.xx.14.1  572a  9e0b  17f063ee a5c5e03d 4a016db9 df37db89 xxxx0e01 00000040 17f063ee a5c4efdd 00
2024-08-29 23:28:54.035277  157.185.173.82   xx.xx.14.1  572a  9e0b  17f063ee a5c60f9a 4a016db9 df37db89 xxxx0e01 00000040 17f063ee a5c4efdd 00
2024-08-29 23:28:54.035277  157.185.173.82   xx.xx.14.1  572a  9e0c  17f063ee a5c7a89a 4a016db9 df37db89 xxxx0e01 00000040 17f063ee a5c4efdd 00
2024-08-29 23:28:54.035277  157.185.173.82   xx.xx.14.1  572a  9e0c  17f063ee a5c7fca8 4a016db9 df37db89 xxxx0e01 00000040 17f063ee a5c4efdd 00
2024-08-29 23:28:54.035277  157.185.173.82   xx.xx.14.1  572a  9e0c  17f063ee a5c833f0 4a016db9 df37db89 xxxx0e01 00000040 17f063ee a5c4efdd 00
2024-08-29 23:28:54.035277  157.185.173.82   xx.xx.14.1  572a  9e0c  17f063ee a5c86515 4a016db9 df37db89 xxxx0e01 00000040 17f063ee a5c4efdd 00
2024-08-29 23:28:54.035277  157.185.173.82   xx.xx.14.1  572a  9e0c  17f063ee a5c897e5 4a016db9 df37db89 xxxx0e01 00000040 17f063ee a5c4efdd 00
2024-08-29 23:28:54.035277  157.185.173.82   xx.xx.14.1  572a  9e0c  17f063ee a5c8cc77 4a016db9 df37db89 xxxx0e01 00000040 17f063ee a5c4efdd 00
2024-08-29 23:28:54.035277  157.185.173.82   xx.xx.14.1  572a  9e0c  17f063ee a5c90031 4a016db9 df37db89 xxxx0e01 00000040 17f063ee a5c4efdd 00
Now it’s even more clear – they’re clearly being sent in groups of 10 (I checked this next against a block of 80 packets, and sure enough, that included 8 different 10-packet blocks).
Some initial observations, by payload word:
- Word 1: 17f063ee (all packets)
- Word 2: 11d….. (1st three nybbles all the same) and a5c….. (2nd block)
- Word 3: 69f69d1c and 4a016db9 (first block, 2nd block)
- Word 4: dc9d6b15 and df37db89
- Word 5: xxxx0e01 (all packets)
- Word 6: 00000040 (all packets)
- Word 7: 17f063ee (all packets - matches word 1)
- Word 8: 11dbe2c1 (first block) and a5c4efdd (second block)
- These start the same way as word 2 (first 3 nybbles match)
- Word 9: 00 (one byte only, always zero) (later, I see 03 here as well)
I then looked at another block of 20 packets, and found very similar results. Then I looked at a bunch of packets. I tried playing with words 3 & 4 to see if they were the IP addresses, but no luck. But I compiled some more thoughts (actual packets not shown here):
- 1: 17f08852 (all)
- 2: varies, all start with 40, 41, 42, or 43, but no clear ordering. The first byte changes every 10 packets.
- 3: 4a016db9 same as .. the two 20-packet blocks coming from ip address 157.185.173.82
- 4: df37db89 just as word 3 - same as word 4 in the above 157.185.173.82 sourced packets.
- 5: xxxx11.. last 2 bytes change every 10 packets. (and the 11 here was 0e in the last block)
- 6: 00000040 (all packets) again, same as everything else so far **
- 7: 17f08852 (all packets - matches word 1) - same as in first two sets of packets
- 8: as before, identical in each 10-packet block. 1st three nybbles match word 2 in the first packet in the 10-block.
- 9: 03 – the last byte in this block is 0x03
Looking for possible correlations, I grouped words 3 and 4 against source IP addresses:
$ ./noise.py greynoise_merged_nolove.pcap --fields src,payload -F words | awk '{print $1 " " $4 " " $5}' | sort | uniq -c | sort -n -r

5706 138.199.4.1        18191a1b 1c1d1e1f
 896 157.185.174.72     64a9bc10 a21ba6f3
 788 157.185.174.73     1dd4bce7 52e10856
 620 157.185.173.82     4a016db9 df37db89
 578 157.185.174.73     0a3c9895 686e6531
 528 157.185.173.82     074b0992 ef8f3419
 409 157.185.173.82     4899ef3b a01e3723
 290 157.185.174.72     69f69d1c dc9d6b15
 198 157.185.174.72     4acd4ee8 aa341a19
 125 187.19.162.131     543303c4 5a0a7cb5
These are clearly linked. Okay, what about the next two words, compared against destination IPs:
$ ./noise.py greynoise_merged_nolove.pcap --fields dst,payload -F words | awk '{print $1 " " $6 " " $7}' | sort | uniq -c | sort -n -r

1197 xx.xx.14.1        xxxx0e01 00000040
 415 xx.xx.157.49      xxxx9d31 00000040
 310 xx.xx.17.59       xxxx113b 00000040
 310 xx.xx.17.39       xxxx1127 00000040
 310 xx.xx.17.16       xxxx1110 00000040
 310 xx.xx.17.13       xxxx110d 00000040
 310 xx.xx.17.122      xxxx117a 00000040
 310 xx.xx.17.116      xxxx1174 00000040
 300 xx.xx.17.72       xxxx1148 00000040
 290 xx.xx.17.14       xxxx110e 00000040
 290 xx.xx.162.96      xxxxa260 00000040
  80 10.0.0.2          xxxxf6fe 00000040
Again, ding.
Oh, damn. LOOK AT THAT “0E 01” in the first row. That’s “14 1” in decimal. This word is just the destination IP address.
My refined observations are now:
- Word 1: same for entire group
- Word 2: changes every 10 packets
- Words 3 & 4: depend on source IP
- Word 5: Destination IP
- Word 6: always 0000:0040
- Word 7: matches word 1
- Word 8: linked to word 2 found in the 1st packet of each 10-packet block
I’m making progress, but still lost on a big chunk of the data. Time to look at frequency counts again. I checked out the distribution of numbers in each byte of the words…how quickly different fields changed, etc…. And I guess I stared at it for a while, then something clicked. Here’s a direct quote from my notes:
OH DEAR GOD. W1/2 and 7/8 are timestamps.
I should have seen that much earlier. After some experimentation, here’s what I concluded:
Date_Time                   Payload
2024-08-16 16:09:36.604415  17ec4e6a 6f4c7354 4899ef3b a01e3723 xxxx117a 00000040 17ec4e6a 6f4bf3a0 03

>>> x=0x17ec4e6a6f4c7354/1000000000; print("%s.%d" % (time.strftime("%Y-%m-%d %H:%M:%S", time.localtime(x)), (x % int(x))*1000000000))
2024-08-16 16:09:36.416838407

- very close to the sniff time above. (same timezone? is everything in UTC?)
- 1000000000 -- 1,000,000,000 -- 1 billionth -- nanoseconds
So what I eventually determined was a structure like this:
| Word Number | 1-2 | 3-4 | 5 | 6 | 7-8 | 9 |
|---|---|---|---|---|---|---|
| Size | 8 bytes | 8 bytes | 4 bytes | 4 bytes | 8 bytes | 1 byte |
| Use | Timestamp | Related to source | Dest IP | 00 00 00 40 | Timestamp | 00 or 03 |
It starts with an 8-byte timestamp (nanosecond precision!), some data I’m not sure about, the destination IP, a 32-bit word that’s always “00000040”, another timestamp (seems to be related to the first packet sent), and finally either a 00 or 03.
I think the “related to src” may be some kind of random indicator to identify the sending process, so return pings go to the right instance for analysis. Or maybe there’s some kind of ipv6 / ipv4 translation happening somewhere? OTOH, v6 addresses are 128 bits long, not 64 bits…and since I have absolutely no practical v6 experience…I’m not going to even speculate there. It’s enough to know that they’re clearly linked to the host and/or process that sends each burst.
Still, the fact that I haven’t figured these fields out annoys me.
All these packets seem to go in 10-ping bursts. My guess is the second timestamp (words 7 and 8) is when the burst began (when the process started, maybe), and the first timestamp is the actual send time for each of the packets. No idea about the 40 or the 00/03, but they obviously don’t carry any actual information since they never change.
So my conclusion is The Seventeens are another kind of high-precision ping time test. These all seem to come in blocks of 10 (that is, for each source and destination pair, there’ll be 10 consecutive pings, while in parallel, a different destination will get a different set of 10 pings, etc.).
Traffic Analysis
So this is what the packets look like, at a low, technical level. But can we learn anything interesting from where they’re traveling, and when? I’ve done a little playing with this, but honestly, I’m not sure there’s enough information in these couple weeks to draw a lot of conclusions. However, I did find a few interesting tidbits.
First off, the three million pings came from just 33 hosts. There was virtually no overlap between any of the ping packet types, suggesting four independent actors. However, one host (138.199.4.1) was seen in both the Linux and Seventeen ping types. And with the exception of three sources for the Seventeens (located in Canada), all IPs seem to be located in Brazil. Note, though that my location-fu isn’t really well developed, and those three Canadian sources may actually be in Brazil.
Meanwhile, the destinations were an interesting mix - with a couple packet types being broadly observed, and others getting much more limited exposure.
| Packet Type | Source Count | Destination Count |
|---|---|---|
| LOVE | 24 | 1 |
| Seventeens | 5 | 15 |
| liboping | 2 | 30 |
| Linux | 1 | 4 |
| Ramius | 1 | 4 |
How does the traffic look, over time? I looked at how many packets were seen each day. It’d probably be interesting to graph this by hour, which might even give an insight into timezones of the actors, if there’s any obvious grouping. But I didn’t do that.
Anyway, back to packets by date. The timestamped Linux pings only ran for a few days, sending to only a few different hosts each day:
| Date | Destination Count |
|---|---|
| 2024-08-18 | 1 |
| 2024-08-19 | 2 |
| 2024-08-20 | 1 |
| 2024-08-21 | 3 |
| 2024-08-22 | 1 |
This looks a lot like one person, running some long-term ping timing app over multiple days, varying the target occasionally. As for the rest of the ping types:
-
The Seventeens ran for the whole timeframe of the dump. Originally, I’d thought that maybe these were an early trial, before moving onto the LOVE tool, but now I’m thinking again that they’re different actors.
-
The liboping packets (remember, only 399 of these total), also appeared fairly continuously.
-
Finally, LOVE – had the most sources, and only a single destination, but nearly 4 orders of magnitude more packets, seen across almost the entire timeframe.
It’s easiest to see the time distribution if we graph the total pings seen over the two weeks of the packet capture. I had to use a logarithmic scale, because otherwise, you couldn’t even see any data aside from the LOVE packets. So keep in mind that the LOVE packets are about 1000 times higher than anything else here.
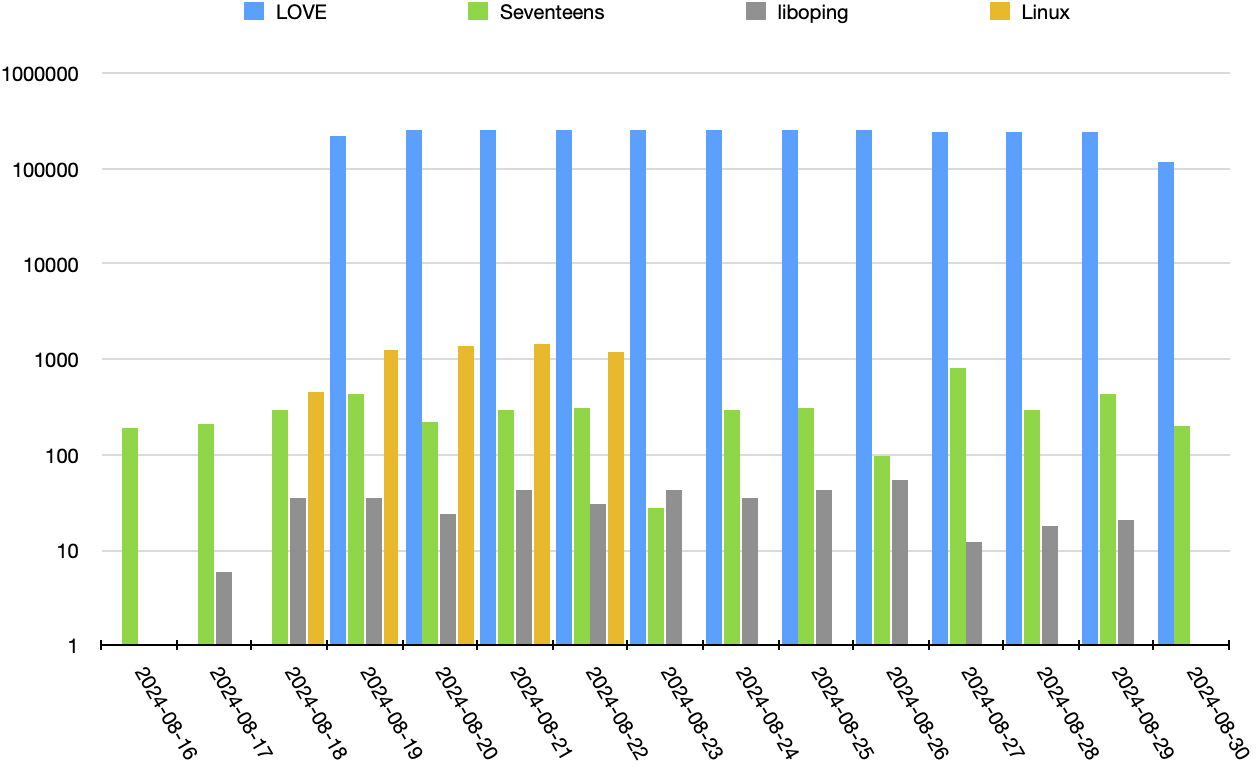
Total pings received
This scale should give you an idea for how insane this traffic is. It’s one thing to map & time packet travel, but it’s a whole different thing to do that using millions of packets, all sent to a single host.
Conclusion
I’m new to watching all this sort of traffic, so I’m not quite ready to conclude much. It looks like, overall, there are four or five different actors here. What they’re doing, I’m not sure, but my hunch is they are all projects to map out or analyze internet transit time, routes, or something like that. How many hosts are they hitting overall?
When I started poking around at all this, I also started capturing pings received at home. Out of nearly 375,000 packets collected over 10 days, I received exactly…0 packets from any of the hosts I’ve seen in this dump. So either they’ve stopped in the last few weeks, or they’re not quite hitting everything on the internet. (I mean, really, I’d suspect most of these sorts of mapping projects will have already identified “well connected” destinations, and a home FIOS connection behind who knows how many intermediate hops doesn’t really qualify). (Still, it would’ve been nice to see a COUPLE of these packet types).
I did see a lot of other random noise, though, that I’m gonna have to strongly resist trying to decipher.
But what can I say about this overall noise storm? The technical details feel, sadly… boring. As I said, possibly mapping or timing experiments. But why the heck is the LOVE experiment blasting so…massively? It doesn’t make any sense to me.
I’m not sure what I’ll do next. There’s still the TCP packets – I haven’t poked at those yet, at all. Probably the next big thing is to take a step back and look at the storms in general. A few basic questions have occurred to me:
- Are any of these packets being seen, not coming from Brazil? How widespread are the sources?
- How much of this traffic is seen outside of GreyNoise? Is there anything common about the endpoints that do see this traffic?
- Do the source and/or destination hosts change much in different storms? Would I have seen a bunch more hosts in this dump if it went two weeks into September as well?
- How often do these noise storms happen?
- For that matter, how do you even define a storm, objectively?
- Is there any pattern to the start, stop, or duration of the storms?
- How does that pattern vary when you isolate the different kinds of ping traffic?
- Is anything interesting happening with other kinds of packets?
- Incomplete TCP handshakes
- GreyNoise said they haven’t seen anything in UDP
- Are there other protocols that are noisy, and we just haven’t looked at them yet? Or maybe some protocols that the GreyNoise network isn’t capturing?
- What about the “low and slow” noise that I saw at home? Lots of weird packets, full of random data – nothing at all like what I saw from the GreyNoise dump. Is there anything interesting there, or is there just a constant hum of random hosts scanning the entire ipv4 space with random ping payloads?
So, to wrap up: Technically, these are all pretty straightforward (if a little weird). But so many questions remain, where are they coming from, is there any pattern to them, what other broad-scale patterns exist, and most importantly, why is one of these so darned LOUD?
Stay tuned…I know there’s at least a few other people, plus probably have the GreyNoise research team, still looking into this. Can’t wait to see what drops next!