

Ping Storms at GreyNoise

Earlier this month, I attended BSidesNoVA in Arlington, where the keynote was presented by Andrew Morris of GreyNoise. Using sensors distributed all over the world, GreyNoise collects…background noise…on the Internet. Basically, they watch and monitor activity that hits lots of hosts randomly – network mapping, port scanning, doorknob rattling. If you see someone trying to break into your SSH server, you can check GreyNoise to see if that person (well, their IP, anyway) has been seen doing such things in the past.
In January 2020, they started seeing massive increases in background noise, especially in ICMP and incomplete TCP handshakes. This was discussed during the talk, along with how the noise seems to come and go, and it’s been driving them crazy. On September 17, GreyNoise dedicated their regular Storm Watch program on YouTube to the phenomenon, and they posted a blog entry about it the next day.
After his talk, we spent about an hour geeking about these storms. I’d worked with him some years back, and he knew how I love these weird puzzles, so he was as eager to talk about it as I was. We discussed all kinds of things – the most intriguing idea was covert communication – and I asked about a million questions, most of which he’d looked into already.
I didn’t get much of a chance to poke at things for the next couple weeks, but after their Storm Watch, I cracked my knuckles (not really – I’ve never been able to do that reliably) and got to work. Yesterday afternoon, I may have figured it out. Well, figured out some of it, anyway.
Gotta Write a Script
But first, I have to figure out how to work with the data. Grey Noise published a huge tranche of data on GitHub, but I wanted to play with a smaller set. Andrew was kind enough to give me access to some other pcaps, and I selected about 200 packets of data from mid-September.
During the Storm Watch segment, we briefly saw a crazy command-line script using tshark and a huge gawk pipeline to parse and display the data. That’s right up my alley – but super complicated. I wanted something where I could easily select which fields I cared about, filter down on specific data, and start to do things like frequency analysis, etc. So I turned to an old favorite: scapy. In short order, I had a tool written that made it a lot easier for me to slice-and-dice the data. Pretty quickly, I came to notice a few details.
But wait, I should back up. One of the more intriguing parts of all this was what’s in these packets. We’re focusing on the ICMP traffic (since it’s much more common in the noise than TCP). These packets look like normal ping requests, but with some random-looking data in the payload. Plus, the word “LOVE.”
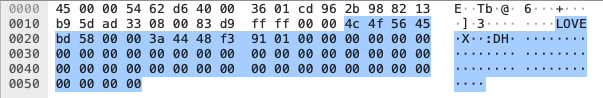
I just LOVE a good mystery...
That hex dump is..hard to focus on. You can see why I wanted my own tool to play with the data. Here’s some of my pcap dump, with just a few fields selected:
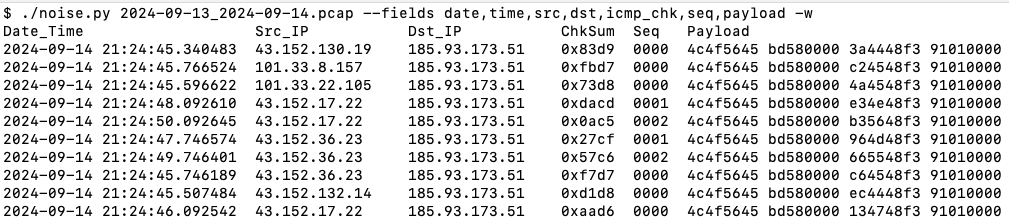
(in the payload, 4c4f5645 = 'LOVE')
Always Crazy in Arlington
Let’s jump back a little, to earlier discussions of just what’s going on. As he talked about the noise during Q&A, I thought of ways this could work as a covert communications channel. The idea being… If the “from” addresses are somehow spoofed, one could broadcast a message, using random sites (GreyNoise sensors) to reflect the traffic to places where you’re watching.
Let’s say it’s WWII, but we have the internet, and you have an agent in Paris. They send a message via a series of pings:
- From Starbucks (I make no judgement about visiting a Starbucks while in Paris), to a GreyNoise sensor in Virginia
- The source address is spoofed, so it looks like the pings are coming from Mexico
- The sensor in Virginia dutifully sends replies to the “source,” that is, some random server in Mexico
- Your handler has a sensor in Mexico City that can receive the packets, which sends them, securely, to your actual destination in London
So the agent has sent a message from Paris to London, but the packets went from Paris, to Virginia, to Mexico. So nobody who’s watching the WiFi in all of the coffeehouses in Paris will ever know that messages are being sent to London.
This sounds super cool! But there are several problems with this theory:
- First, this relies on the packets with spoofed origin addresses even getting sent out. From what I understand, a properly configured network that sees these packets, should just drop them (since they obviously shouldn’t be there in the first place).
- Why is there no background noise? This traffic come in long bursts (sometimes days or weeks at a time), but there’s nothing in between the bursts. If you want the channel to look like noise, it needs to be noisy all the time, like Numbers Stations constantly transmitting on shortwave frequencies.
- Similarly, why call attention to yourself with the word “LOVE” in cleartext in the message?
- Finally, there’s simply not enough data in these packets. In particular, it seems like there’s really only 3 or 4 bytes per packet that could be carrying an actual message – that’s a lot of work to send a highly important message three letters at a time.
- Finally, couldn’t you just use…about anything from the App Store? (okay, maybe not, but still, this seems like a pretty complicated approach). This isn’t WWII, and we’re not talking about Special Operations Executive with hand-coded messages going out over shortwave transmitters in haylofts and Parisian attics.
Don’t get me wrong – I love the idea, and have already imagined a half-dozen approaches using pseudorandom keystreams and encrypted data… But if I can come up with a much better way to do this, then anything that actual, professional, you know, SPIES, could do, would probably not be something we’d even notice.
Looking at the Data
So…just how much data is in here? Is there any chance there’s some information being transmitted? Let’s look more closely at the payload.
In the screenshot above, I broke the payload up into four 32-bit words (broken up here a little more for readability):
| 4C4F 5645 | BD58 0000 | 3A44 48F3 | 9101 0000 |
|---|
- The first column is the word “LOVE” in ASCII (4c 4f 56 45). It doesn’t change.
- The second column here is all BD58 0000. The second half (0000) never changes, but the first half varies among maybe a half-dozen different numbers in the 200 packets I’m playing with. So these may be some kind of marker, grouping indicator, etc. But certainly not variable packet-by-packet data.
- The last column is 9101 0000 all the way through. Again…intriguingly boring.
- It’s the third column that seems interesting. The first three bytes (3a 44 48 in the first row) change constantly, and I don’t need math to see that they’re probably hitting all 256 possible values. The last byte is f3 in just about every packet I have (except for three which are f1).
Okay, so… There’s maybe 3 bytes of actual, variable traffic here. Could these somehow be assembled into an encrypted message? Possibly, but again, it seems like a lot of work.
More Data!
At this point, I’ve got a tool that kind of works, and now I should really start looking at more data. So I pull down one of the big capture files from GitHub, point my script at it, and…I wait. And wait. And wait some more. Turns out, the scapy library is loading the entire 44 megabyte capture file into memory at once. That’s not gonna work for rapid “try this field” and “filter on that field” poking around. So I need to rewrite my tool with a different packet analysis library.
Turns out, Wireshark has a good python library, and doesn’t have to pre-load the whole file into memory. It’s an easy job to convert my script to use that, and — wait, it crashes? Okay, print() to the rescue! There’s something broken about the data field (maybe it’s missing?), so I set a trap there, and show the broken packet. Wait. WTF? A chill runs down my spine..I may have accidentally figured this out.
Suddenly, I have chills...
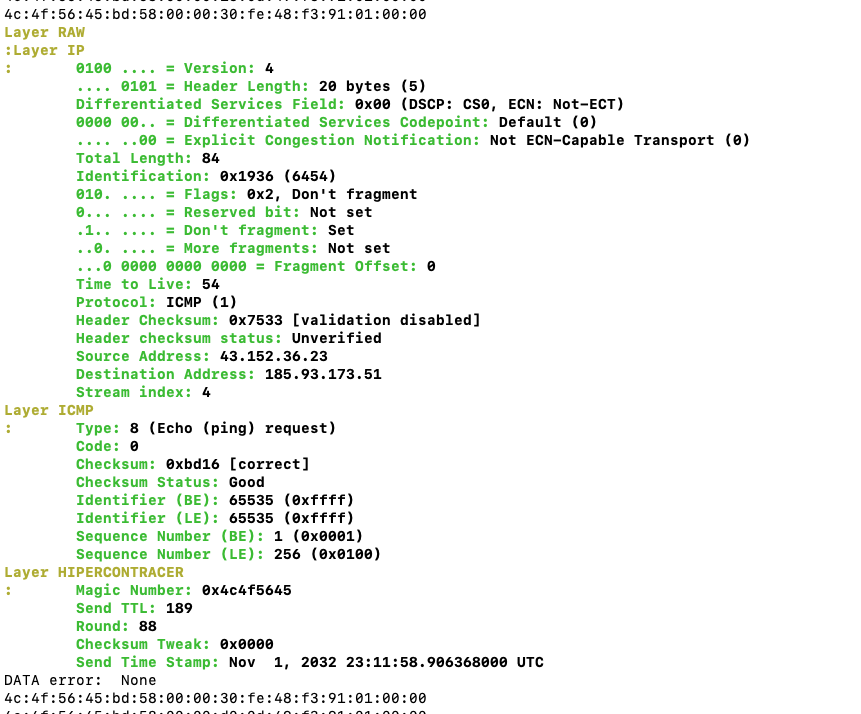
What is this showing? The pyshark library is interpreting the ping payload as a “HIPERCONTRACER” packet. This causes the ICMP payload field to be discarded, which makes my script crash when it tries to print the (now non-existent) field.
Looking at the packet, I see “LOVE” identified as a “Magic Number,” which is a way to easily identify files, packets, etc., as belonging to a particular data type (like a Zip file starting with “PK” or a .png starting (nearly) with “PNG”). That makes sense. Then, the BD58 bytes are split into a TTL (time-to-live) figure and a “round” (like…sending multiple groups of pings). Whatever, sure. The next block, all 0s, is itself identified as a field, which again, is consistent with what I’m seeing. And…a timestamp? But the date is all wrong.
Okay, this is intriguing. But why this one packet? Here’s the whole payload for that one:
| 2024-09-15 01:25:34.956 | 4c4f 5645 | bd58 0000 | 0006 49f3 | 9101 0000 |
|---|
So…it’s treating 000649f391010000 as a timestamp. Let’s do some silly python magic (I’ve already guessed that it’s in milliseconds, so I’m dividing the number by 1000 to get a “normal” UNIX epoch time):
>>> print(time.strftime("%Y-%m-%d %H:%M:%S", time.localtime(0x000649f391010000/1000)))
58064-02-23 10:41:46
Nope. That’s clearly not right. Wait! What if it’s backwards!
>>> print(time.strftime("%Y-%m-%d %H:%M:%S", time.localtime(0x00000191f3490600/1000)))
2024-09-14 21:25:34
BOOM! That matches the GreyNoise sensor’s sniff time. This is a timestamp. It’s a UNIX epoch time, in milliseconds, stored in little-endian format (that means the lowermost bytes come first. Like writing 8,675,309 as 9035768. It’s a thing that goes back to how the computer hardware actually accesses data from memory).
Why doesn’t it match what Wireshark shows? No idea. Why did this packet pop? I think it’s that “00” in “0006” – in every other packet in my test file, that’s non-zero. This zero makes the date look “plausible”, and so Wireshark recognizes it.
If that byte hadn’t been 00, and I hadn’t moved to pyshark, I might never have made this connection.
Sometimes, life’s victories are just dumb luck.
HiPerConTracer
So what exactly is this HIPERCONTRACER thing? A quick search leads me to this old-school academic page. It’s used, as far as I can gather from the various papers and presentations, to monitor and analyze packet travel time on the internet. This seems like a very reasonable explanation for what we’re seeing. Someone started a project to monitor traffic, and either they are trying to graph its changes throughout the day (over multiple weeks), or…they just forgot to turn it off.
And because this is an academic project, it’s virtually all available online, including source. Some quick poking around gets me to this snippet in the source code:
// ==========================================================================
// Format:
// 00 4 MagicNumber
// 04 1 SendTTL
// 05 1 Round
// 06 2 Checksum Tweak
// 08 8 Send Time Stamp
// ==========================================================================
This not only matches what Wireshark showed, but definitely confirms my thinking, and what the other packets look like.
But..is this really it? Let’s see if I can look more closely at the other packets. I spent some time trying to get them to show up in Wireshark itself, thinking that maybe I’ll see obvious patterns in the “BD 58” fields, but I just couldn’t get them to be recognized, no matter what I did to tweak the timestamp data.
By now, I’m just tired, and aimlessly poking around at how Wireshark filters work. Maybe I make my own packet “dissector” to decode my packets, if the default parser won’t work. I find the source code for the HiPerConTracer dissector in the Wireshark repository on Gitlab, and it expects a header that’s different from the tool’s source:
/* Setup list of header fields */
static hf_register_info hf[] = {
  { &hf_magic_number,   { "Magic Number",    "hipercontracer.magic_number",   FT_UINT32, BASE_HEX, NULL,                 0x0, "An identifier chosen by the sender upon startup",                       HFILL } },
  { &hf_send_ttl,       { "Send TTL",        "hipercontracer.send_ttl",       FT_UINT8,  BASE_DEC, NULL,                 0x0, "The IP TTL/IPv6 Hop Count used by the sender",                          HFILL } },
  { &hf_round,          { "Round",           "hipercontracer.round",          FT_UINT8,  BASE_DEC, NULL,                 0x0, "The round number the packet belongs to",                                HFILL } },
  { &hf_checksum_tweak, { "Checksum Tweak",  "hipercontracer.checksum_tweak", FT_UINT16, BASE_HEX, NULL,                 0x0, "A 16-bit value to ensure a given checksum for the ICMP/ICMPv6 message", HFILL } },
  { &hf_seq_number,     { "Sequence Number", "hipercontracer.seq_number",     FT_UINT16, BASE_DEC, NULL,                 0x0, "A 16-bit sequence number",                                              HFILL } },
  { &hf_send_timestamp, { "Send Time Stamp", "hipercontracer.send_timestamp", FT_ABSOLUTE_TIME, ABSOLUTE_TIME_UTC, NULL, 0x0, "The send time stamp (microseconds since September 29, 1976, 00:00:00)", HFILL } }
};
Wireshark may be expecting an additional 2-byte word (the “Sequence Number” field) that I’m not seeing. That’s interesting, especially since that’s not being displayed in the packet dump. Or maybe the mac version is out of date?
But what’s more telling is the definition of the timestamp. Instead of UNIX epoch (Jan 1, 1970), and milliseconds, it’s using microsecond precision, with the epoch date of Sep 29, 1976. Not sure why 1976, but this explains why the displayed timestamp was so weird, and why I couldn’t get Wireshark to like any of my “fixed” packets.
Oh, and there’s another interesting tidbit: The “Checksum Tweak” is, according to what I’ve been reading, an arbitrary 16-bit field that gets automatically adjusted to ensure that all packets in the same “session” have the same ICMP checksum. This should fool network gear into thinking they’re the same packet, so they get routed over the same path, for consistency in timing. In the packets I have, that field is always zero.
So…is this it?
At this point, I’m pretty confident that I’ve got this figured out. (well, the “LOVE” packets, at least). Obviously I’m confident, otherwise, I wouldn’t be writing this post.
It looks like:
- Someone is using a modified version of HiPerConTracer:
- Designed to use UNIX timestamps with slightly less resolution
- Not using the Checksum tweaking to ensure consistent routing
- It’s either running continuously, to gather hour-by-hour congestion data, or they started an experiment and forgot to stop the program
Is this it, then? Not really. There’s still a lot to look at in the storms. Looking through the larger packet capture files shared by GreyNoise, I see:
- Packets with a payload of “liboping – ICMP ping library http://octo.it/liboping/”
- “Normal” ping sweeps (payload: !"#$%&'()*+,-./01234567)
- Lots of packets that start with “17ec436a” (or a few other blocks of numbers) and lots of random, or near-random, looking data afterwards.
- In the one big dump I was looking at, those mostly went away and were replaced by LOVE packets, so maybe they’re an earlier test version?
- There’s also the incomplete TCP handshakes, though those may have even less data to look at
But for the LOVE packets, at least, I think this seems a pretty likely explanation.
Thanks for the quick diversion, Grey Noise!